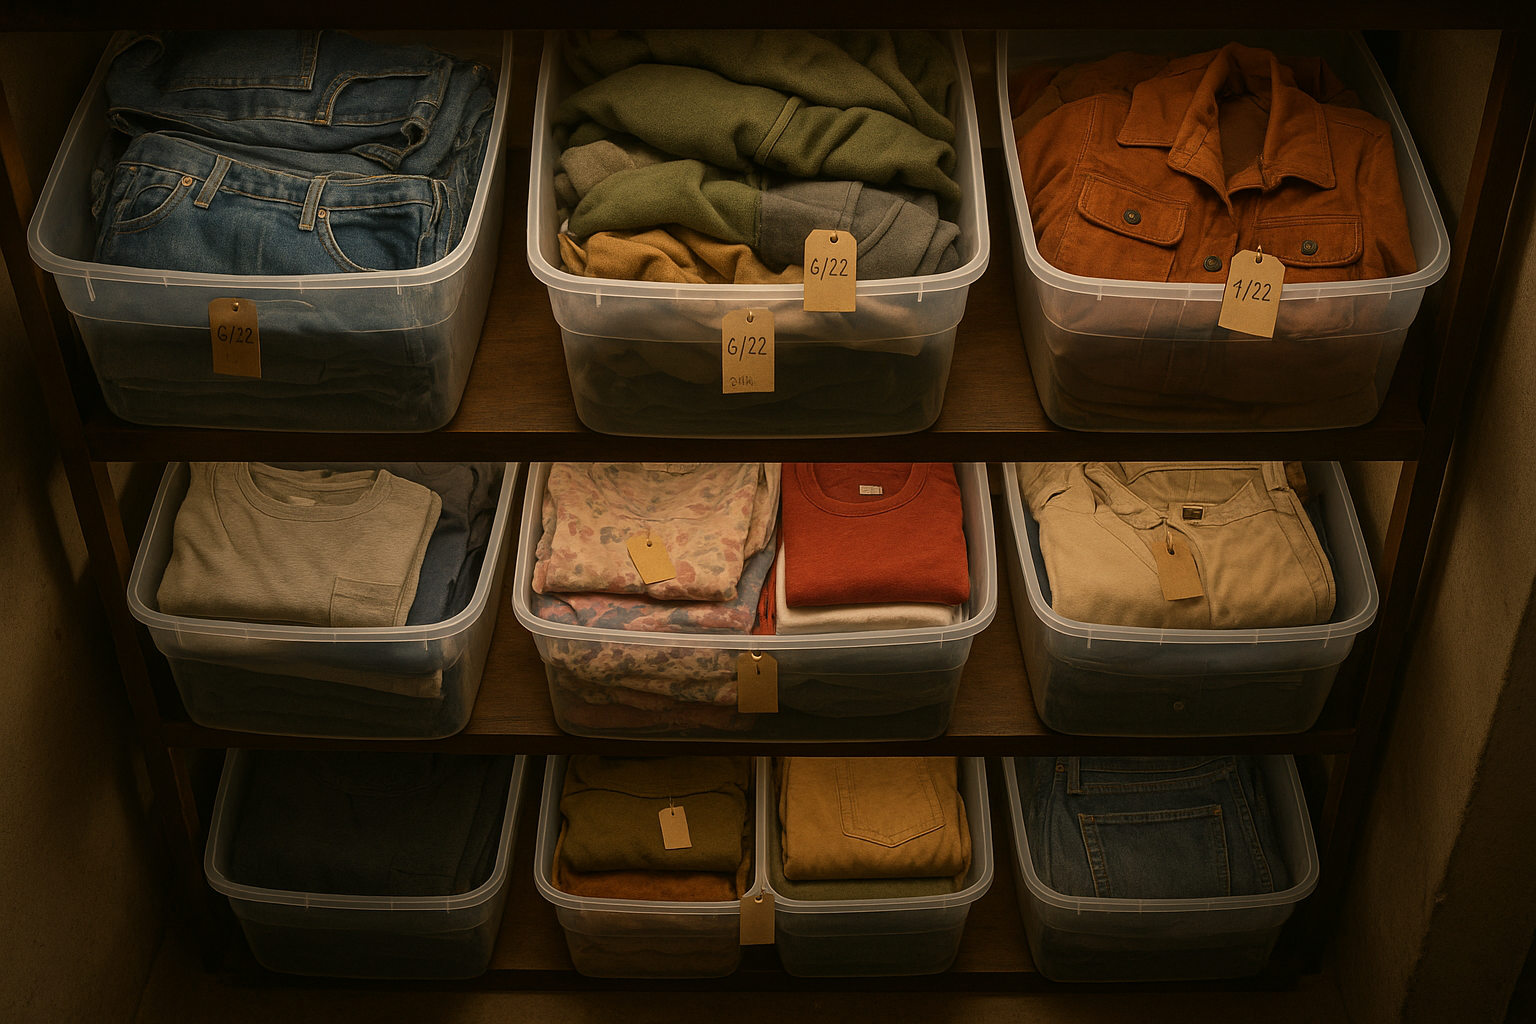
Inventory turnover rate = cost of goods sold in a period ÷ average inventory value for that period. A reseller turning inventory 6 times a year recycles capital every 61 days. A reseller turning it 2 times a year recycles capital every 182 days. Every extra day a $22 flannel sits in a bin, it costs you storage space, tied-up cash, and a rising chance you'll have to reshoot and re-grade it before it sells.
Most resellers track sell-through rate (percentage of listed items sold) and stop there. Sell-through tells you what sold. It doesn't tell you how long your money was parked in what didn't. Turnover rate does. Once you calculate it by category, the slow-moving 10-20% of your inventory usually turns out to be the reason cash flow feels tighter than your sales suggest.
How to Calculate Inventory Turnover Rate as a Clothing Reseller
Turnover rate answers one question: how many times did you cycle through your average inventory value in a given period? Applied to a reseller's books:
Turnover Rate = COGS of items sold ÷ Average Inventory Value (at cost)
Example: over a quarter, you sold items with a combined cost basis of $9,000. Your average inventory value at cost, (starting value + ending value) ÷ 2, was $6,000.
$9,000 ÷ $6,000 = 1.5 turns per quarter, or 6 turns annualized.
Convert that into days on hand by dividing the period length by the turnover rate:
Days on Hand = Days in period ÷ Turnover Rate
91 days ÷ 1.5 = about 61 days on hand. That's your average holding period. Anything sitting meaningfully longer is dragging turnover down.
[Screenshot placeholder: FlipDesk inventory dashboard showing turnover rate and days on hand by category]
Two details that trip people up:
- Use cost, not list price. Valuing inventory at list price inflates the denominator and makes turnover look worse than it is.
- Use the right COGS. Include item cost plus any cost you capitalize per item (cleaning supplies, repairs, tailoring). Leave out shipping and marketplace fees, which are selling expenses, not inventory cost. Be consistent so period-over-period comparisons mean something.
- Average more than two points if you can. If inventory swings a lot (a big haul landing mid-month), average month-end values across the quarter instead of just start and end.
The Real Cost of a Slow-Moving Item
A $22 cost-basis flannel that sells on day 14 and one that sells on day 180 show the same revenue line. They do not produce the same profit, because holding cost accrues daily. Here's what builds while an item sits:
| Cost category | What it is | Rough cost at 180 days (example) |
|---|---|---|
| Capital cost | Cash tied up that isn't buying new, faster-turning inventory | $22 cost basis unavailable for several more sourcing trips |
| Storage cost | Bin space, shelving, unit rent allocated per item | $0.03-$0.08/day per hanging item in a mid-size operation (example; use your own rent ÷ item count) |
| Condition decay | Fading, dust, pilling, odor absorption from prolonged storage | Risk of grade slipping a tier |
| Re-listing labor | Reshooting, re-measuring, rewriting a stale listing | 8-12 minutes at your effective hourly rate |
| Fee drift | Promoted listing spend or fee changes accumulating while an item sits | Variable, rarely trends down |
Here's the math on one example. Say the flannel sells for $48 with $22 cost, about $6.50 in fees, and $5 shipping. At day 14 that's roughly $14.50 profit. At day 180, add roughly $9 storage (at $0.05/day), 10 minutes of relisting labor (about $2.50 at $15/hour), and the opportunity cost of $22 that could have turned several times elsewhere. Profit on the unit drops to about $3, before counting that opportunity cost. Same sale, very different business.
Turnover math isn't an accounting exercise. It's the difference between inventory that compounds and inventory that accumulates.
Slow-Moving Inventory Holding Cost: A Quick Formula
To put a number on your own pile, use this:
Daily holding cost per item = (cost basis × daily capital rate) + daily storage allocation
For capital rate, use what your cash could earn if redeployed. If a dollar of stock typically turns 6 times a year at a 45% gross margin, your realistic opportunity cost is far above a savings account rate. Even a conservative 20% annualized figure on a $22 item is about $0.012/day, plus $0.05 storage, or roughly $0.06/day. Over 180 days that's about $11, half the item's cost. Swap in your own numbers; the point is the habit of pricing the wait.
Inventory Days on Hand: The Reseller Metric That Tells You When to Act
Categories have different natural velocities. A graphic tee at the right price should move in under 30 days. A structured blazer or niche vintage piece might reasonably take 60-90. The problem isn't a slow category. It's not knowing your own baseline, so you can't spot outliers.
| Category | Healthy days on hand | Watch-list threshold | Action threshold |
|---|---|---|---|
| Basic tees / fast fashion | 15-30 days | 45 days | 60+ days |
| Denim | 30-45 days | 60 days | 90+ days |
| Dresses / occasion wear | 30-50 days | 70 days | 100+ days |
| Outerwear (off-season) | 60-90 days | 120 days | 150+ days |
| Designer / resale-grade vintage | 45-75 days | 100 days | 140+ days |
These are starting benchmarks, not rules. Pull six months of your own numbers and you'll have a baseline specific to your sourcing mix and price points. Seasonality matters: a wool coat at 120 days in July is on schedule, not stale, so set seasonal categories to age from the start of their selling window.
Step-by-Step: Calculate Your Own Turnover Rate
- Pull total COGS for items sold in your chosen period (monthly or quarterly is most actionable) from your P&L or inventory tracker.
- Pull your inventory value at cost at the start and end of that period: the sum of unsold cost basis, not list price.
- Average the two inventory values: (starting value + ending value) ÷ 2.
- Divide COGS sold by average inventory value to get turnover for the period.
- Divide the number of days in the period by the turnover rate to get days on hand.
- Annualize if you want a comparable figure: multiply a quarterly rate by 4, or a monthly rate by 12.
- Repeat the calculation by category or price tier, because a blended number hides the categories dragging you down.
- Flag any SKU past your category's action threshold and route it into a rotation decision: discount, bundle, relist, or liquidate.
Once you have this by category, the picture sharpens fast. In many shops a small share of SKUs, often 10-20%, accounts for a large share of the days-on-hand drag. Check your own split rather than assuming it. It's usually a small, fixable pile, not the whole business.
A Stock Rotation System for Clothing Resellers
- Tag every item with an intake date at the SKU level, not just a bin label. This is what makes days-on-hand math possible per item instead of per period.
- Record the grade at intake (NWT, NWOT, Excellent, Very Good, Good, Fair, or Poor) so you have a baseline if the item ages.
- Run a weekly or biweekly aging report, sorted oldest to newest by category.
- Set a review trigger at your watch-list threshold: reshoot photos, rewrite the title, check item specifics, or reprice. Don't let it keep sitting.
- At the action threshold, apply your discount ladder (below) instead of letting the item drift.
- At a final threshold, typically 150-180 days for most categories, bundle, liquidate, or donate rather than let it occupy bin space and capital. Check with your tax adviser on how donations are treated for your business.
[Screenshot placeholder: aging report sorted by days on hand with watch-list and action flags]
When to Discount Slow-Moving Items on Resale Platforms
Discounting isn't giving up margin. It converts a depreciating asset back into cash you can redeploy into faster-turning stock. A staged ladder keeps the discount proportional to the holding cost already accrued:
| Days on hand | Suggested action | Typical discount |
|---|---|---|
| 0-30 | Hold at original price | 0% |
| 31-60 | Refresh title/photos, minor reprice | 5-10% |
| 61-90 | Active markdown, cross-list if not already | 15-20% |
| 91-120 | Bundle with related items or send offers to watchers | 25-30% |
| 120+ | Liquidate, lot-sell, or donate | 35%+ or exit |
Use the platform mechanics to execute the ladder. On eBay, send offers to buyers watching the item and use markdown or sale tools rather than ending and relisting blindly. On Poshmark, a price drop notifies people who liked the item, and offers to likers can move a stale listing. On Mercari, a price drop does the same for people who liked it. Before you cut price, confirm the item isn't slow because of a fixable listing problem: weak title keywords, missing item specifics, or thin photos. A price cut on a badly listed item just gives away margin.
The discipline matters more than the exact percentages. An item that never gets a scheduled markdown accumulates holding cost silently until you notice it's been in the same bin for five months.
Why Condition Decay Is a Hidden Turnover Killer
The longer an item sits, the more likely its actual condition drifts from what your listing says, and the more likely a buyer notices before you do. Fold lines set into fabric, dust settles into knit fibers, elastic in waistbands and cuffs loses recovery, and colors exposed to light fade unevenly. In GradeThread's grading vocabulary, that's movement across more than one of the five factors: Fabric Condition from prolonged storage stress, Cosmetic Appearance from fading or new marks, Functional Elements when elastic or zippers degrade, and Odor & Cleanliness if bins sit in a garage or storage unit without ventilation. An item graded Excellent at intake six months ago is not guaranteed to still grade Excellent today. If a buyer receives something a full tier below the listing, that's a return or a not-as-described case, not just a slow sale.
This is the direct link between turnover and returns math: the faster you move inventory, the less time condition has to decay between grading and delivery, and the more your listed grade matches what ships. A standardized grade at intake gives you a documented baseline. If you have to re-inspect an aged item before discounting and relisting it, you're confirming against a record, not guessing from memory.
Put the Math to Work
Calculating inventory turnover rate once, by hand, from a spreadsheet is a useful exercise. Doing it weekly, by category, across 500 SKUs is a job for software. That's what FlipDesk's inventory ops tracking is built for: intake dates, aging alerts at your thresholds, and days-on-hand reporting by category, so slow movers surface before they've cost you three sourcing trips' worth of tied-up capital. Pull your own numbers this week. Even a rough turnover rate for last quarter will tell you more than your sell-through percentage ever has.